

Infographics and interactive tools

Wittgenstein Centre Data Explorer
The data explorer allows to browse, select, visualize and download assumption and result data.

How much of Europe will be old in 2050?
Based on Sanderson, W., and Scherbov, S. (2015) Faster increases in human life expectancy could lead to slower population aging. PLOS ONE, 10(4):e0121922 doi:2015.10.1371/journal.pone.0121922

What's my place in the world population? How long will I live?
IIASA researcher Samir KC together with colleagues from the World Bank have developed an interactive tool that shows the journey of an individuals life in numbers and dates http://population.io/
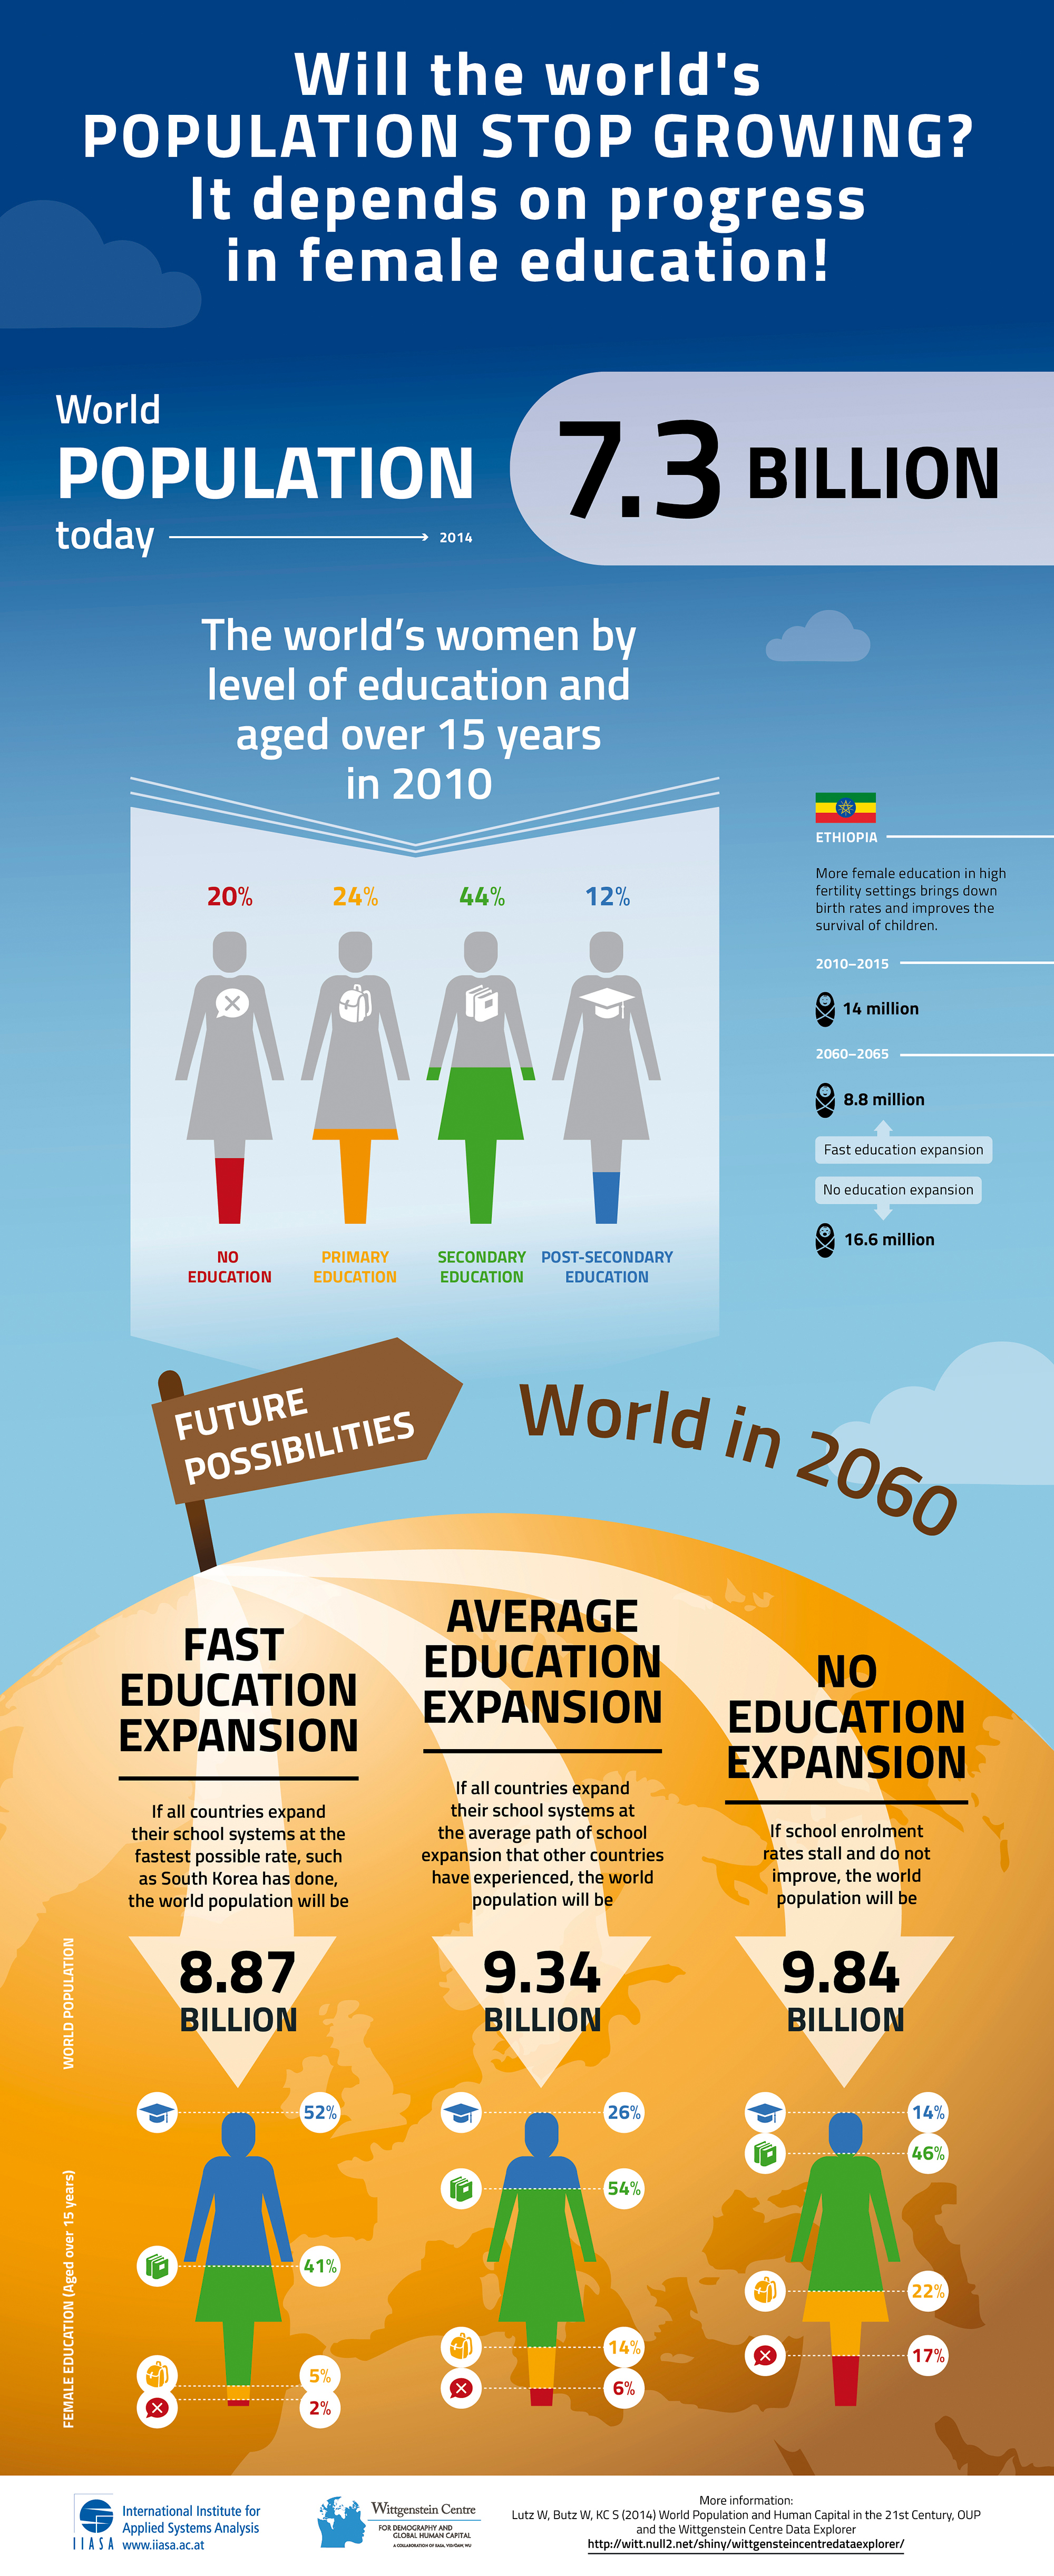
Will the world's population stop growing?
Based on Lutz, W., Butz, W.P., and KC, S. (2014) World Population and Human Capital in the 21st Century, Oxford University Press; and the Wittgenstein Data Explorer http://witt.null2.net/shiny/wic/

PUBLICATIONS